
Measuring How Social and Video Content Performs on Google
LE VENT GLOBAL MEDIA · SEO
Measuring How Social and Video Content Performs on Google
A video receiving many views within a platform does not mean it attracts a comparable number of visits from Google. To measure discovery through Google, track search impressions, search clicks and engagement within the platform separately. This distinction helps content teams make better decisions about which subjects to expand and which formats to improve.

Businesses using a blog, YouTube and short-video channels together often answer the same question in different formats. Combining every channel into one “reach” figure obscures the role each piece of content plays. This guide turns the Search Console platform properties introduced in 2026 into a practical working and reporting process.
What new measurement became available in 2026
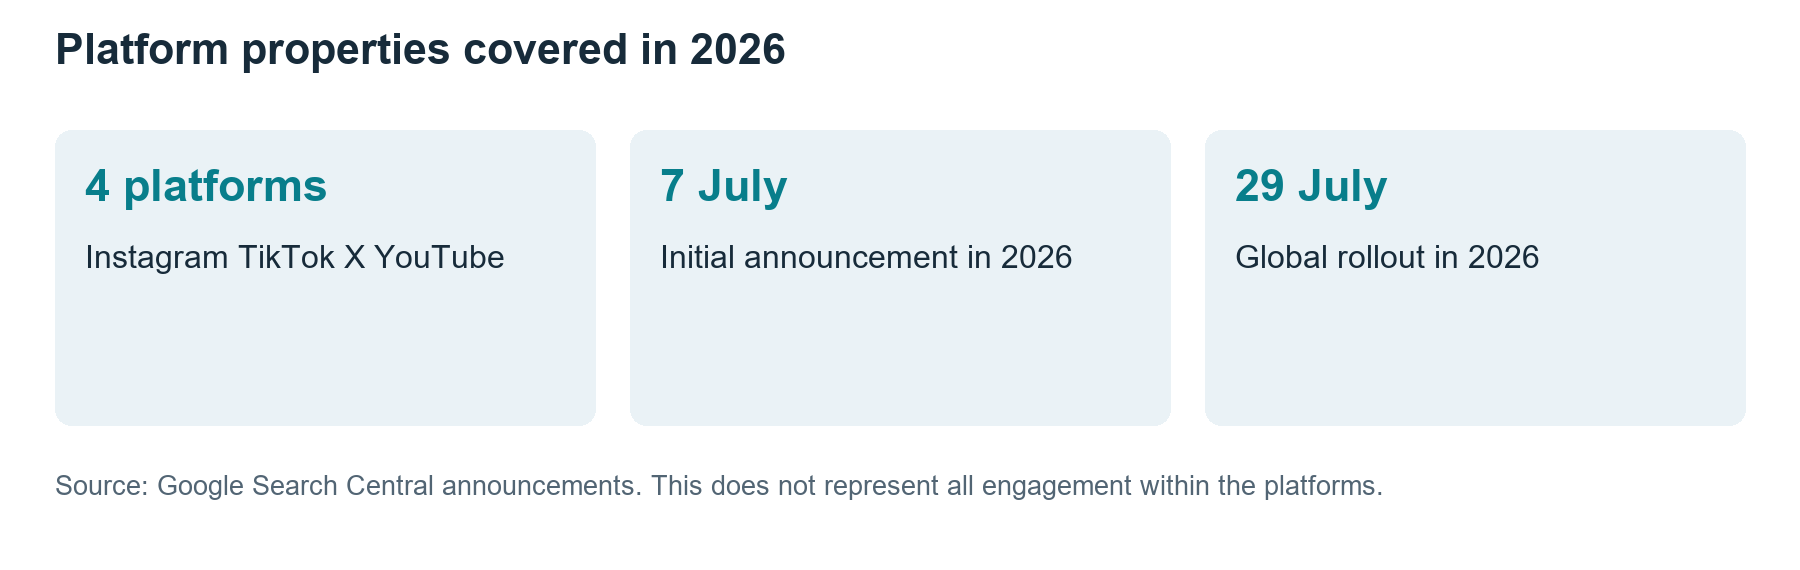
On 7 July 2026, Google announced platform properties for Instagram, TikTok, X and YouTube. These properties let you examine the queries through which posts are discovered on Google and which content receives clicks. Setup involves selecting the relevant platform and following the on-screen verification steps. [1] Check that the account you connect belongs to the business and is managed by an authorised person.
The announcement of 29 July 2026 states that the global rollout had been completed. Google’s accompanying analytical recommendations cover comparing rising query groups, current traffic movements and different content formats. [2] This does not mean Search Console measures the social platforms’ own recommendation algorithms.
Establish responsibilities before connecting measurement
For a content manager, the first question should be “Who can see all the data?” Connecting data before clarifying account ownership, agency access and report recipients can create problems later. Do not use personal accounts as shared corporate accounts. Define whose access will be removed when the engagement ends as part of the process.
Once the account is connected, record the date range, country, device and report type. Do not compare one channel’s last seven days with another’s last twenty-eight days in the same table. If no data appear, do not immediately conclude that “Google is not showing us”. Check that you selected the correct property, completed verification and have reportable data for the period concerned.
Check | Information to record | Why it is needed |
|---|---|---|
Property and account | Platform and account identifier | Prevents using the wrong account’s data |
Permissions | Owner and teams with access | Clarifies responsibility |
Scope | Date, country, device and surface | Makes comparisons meaningful |
Change | Post URL and revision date | Provides context for later interpretation |
Build a measurement chain from impressions to business outcomes
A search impression records your content appearing on a search surface. A click records a user interacting with that result to proceed to its destination. Video views, watch time and likes within a platform are different measurements. Submitting a form on your website may be a later step. The same person can generate several records along this chain.
For this reason, specify the data type when adding figures from different systems. Claiming a “total audience” requires deduplicated user data. Adding Google clicks to platform views does not produce that measurement. Nor does a click from Google to a social post demonstrate that a later action on your website can automatically be attributed to that post.
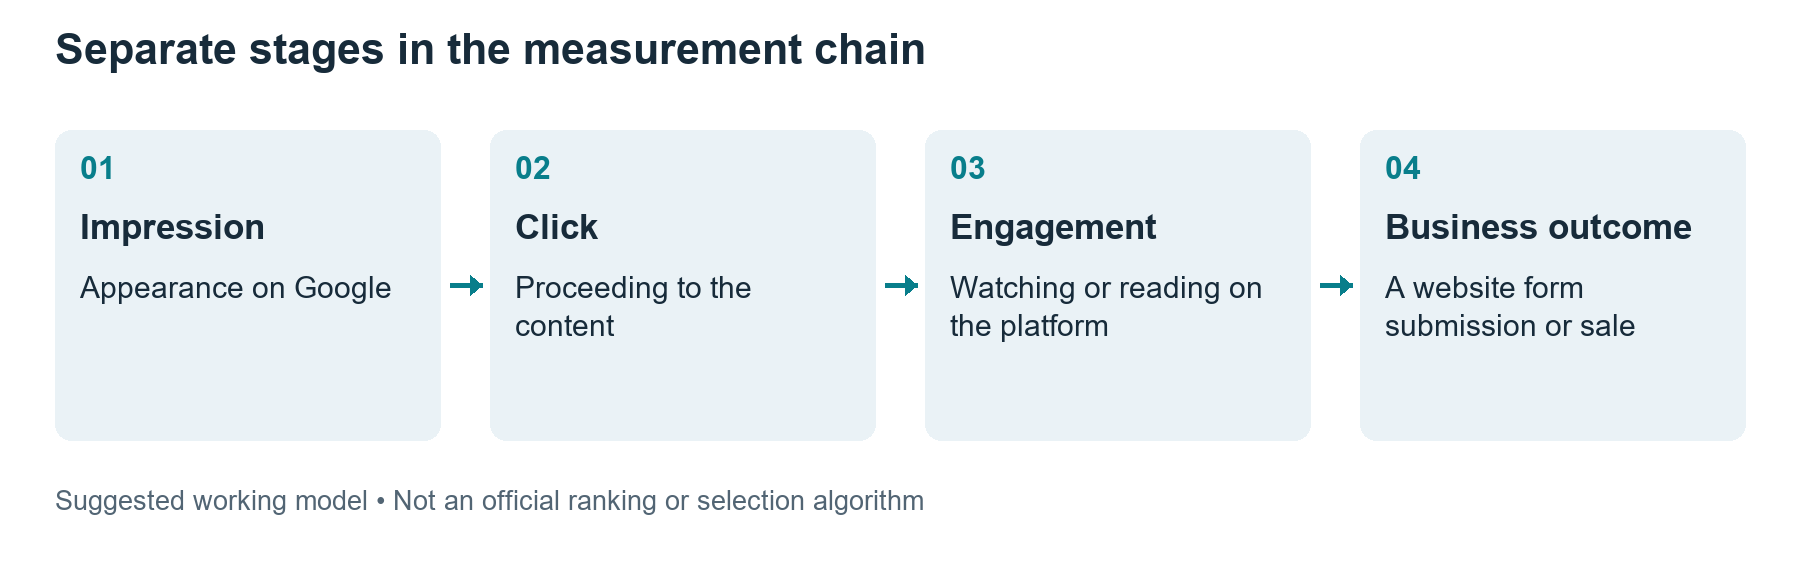
You can use consistent campaign tags on links directing people to your website. However, the platform’s click count, analytics sessions and form submissions may not match exactly. Consent preferences, changing devices and navigation within an app can affect measurement. Rather than concealing discrepancies, state which data came from which system in the report.
Turn query groups into content decisions
Do not use queries merely as a list of the keywords generating the most clicks. Classify the problems people are trying to solve. For a business selling a technical product, “how to install”, “which model is compatible” and “why is there an error” represent different needs. Even when the same product name appears, one short video may not adequately answer them all.
For example, if an installation video is discovered in search but also receives impressions for compatibility queries, the next piece could be a compatibility comparison. This may be more useful than lengthening the existing video’s title to include every query. First watch the video to verify which question it actually answers.
Compare topic groups with customer conversations. If a frequently searched error message is also a concern for support staff, content can serve discovery and customer support alike. A product condition with low query volume but costly consequences if misunderstood may also deserve priority. Assess numerical interest alongside business importance.
Maintain a consistent basis when comparing channels
The table below is a calculation example, not data from a real brand or average platform performance. It assumes all four channels are reported for the same period and Google Search scope. Because their content types and subject mixes may still differ, it cannot establish that one platform performs better for every business.
Channel | Impressions and clicks | CTR |
|---|---|---|
10,000 impressions / 200 clicks | 2% | |
TikTok | 5,000 impressions / 150 clicks | 3% |
YouTube | 12,000 impressions / 120 clicks | 1% |
X | 3,000 impressions / 120 clicks | 4% |
Total | 30,000 impressions / 590 clicks | ≈1.97% |
The total of 30,000 impressions and 590 clicks gives a CTR of approximately 1.97%. Simply averaging the channel rates produces 2.5% and misrepresents the overall result. The correct method is to divide clicks collected within the same scope by total impressions. The report should also state that impressions are not unique people.
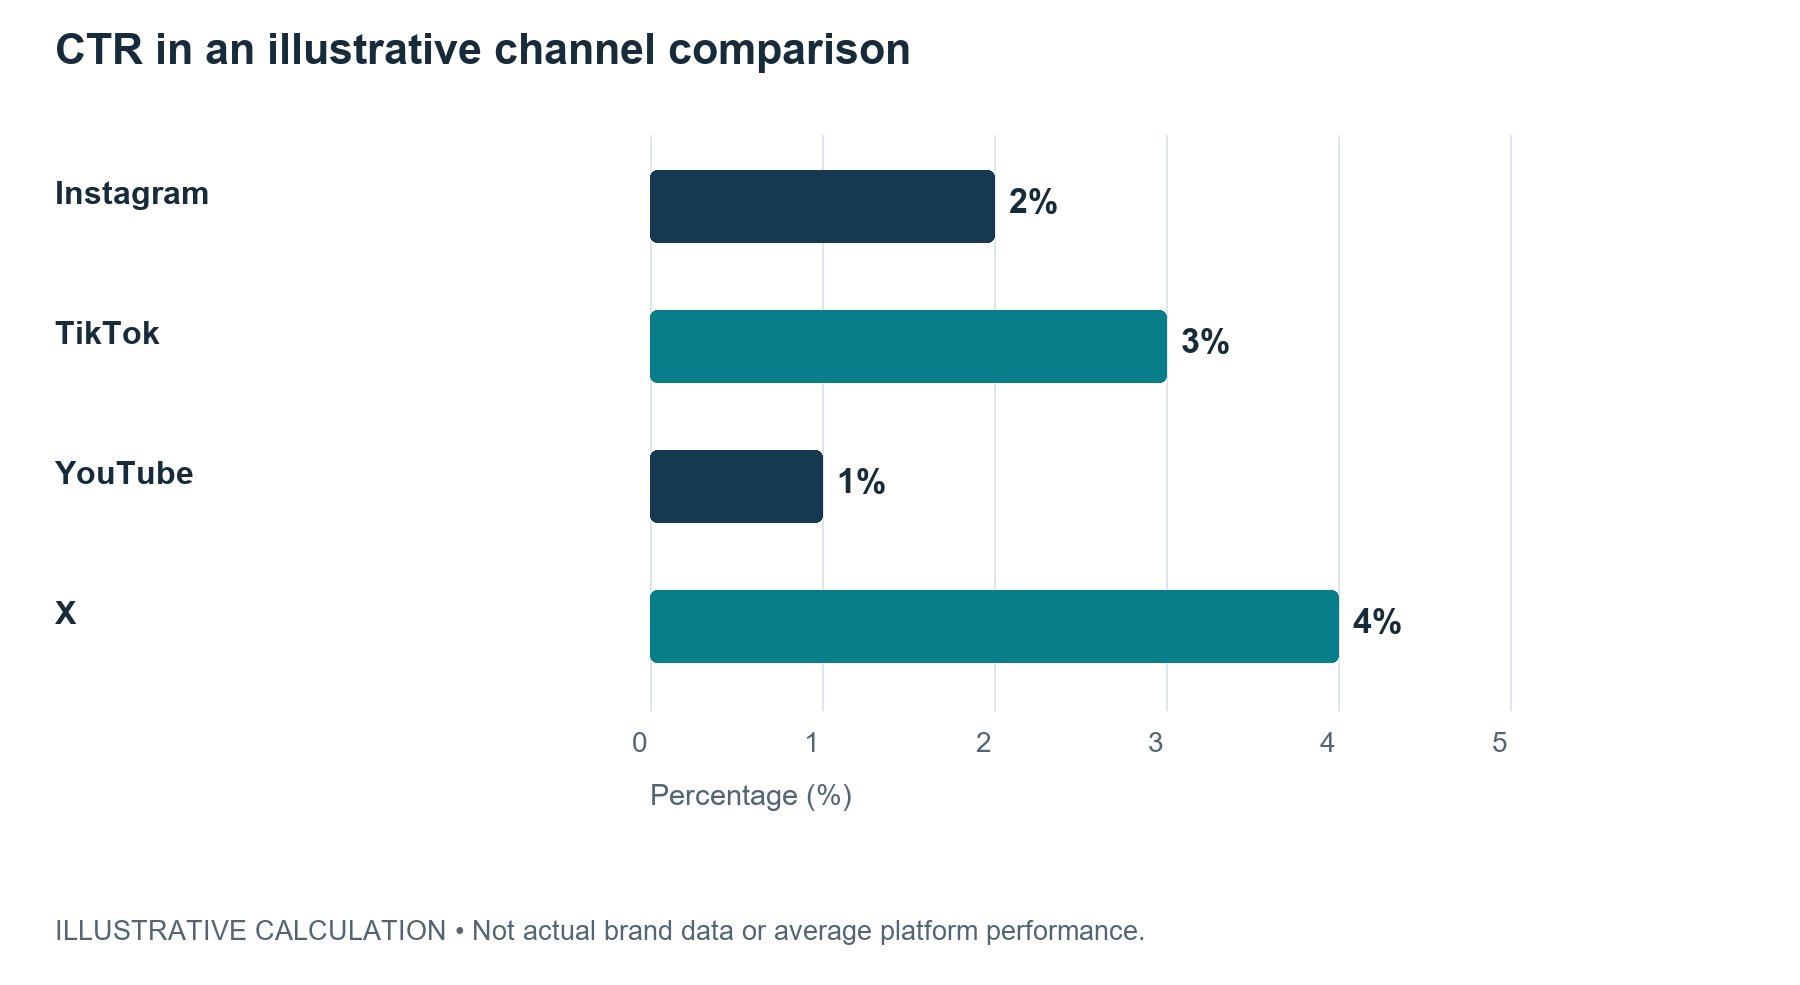
Do not choose content solely by the highest CTR. In the example, X’s 4% rate does not mean it generated more clicks than YouTube; both have 120 clicks. Furthermore, a video helping people choose the right product could generate more qualified enquiries with fewer clicks. Assess data on subsequent steps separately to investigate that relationship.
Reassess older content
When a post becomes visible again, check that its information is still valid before automatically sharing it again. Has the product version changed, is the on-screen menu still the same, and is the recommended method current? If the answer is outdated, adding an explanation, linking to the new version or making a follow-up video may be more helpful.
Record what you change in the older post. If its title, description, pinned comment and website destination all change at once, distinguishing which element made a difference becomes difficult. If the work requires correcting all of them, do so; just do not describe it in the report as a single-variable experiment. Distinguish observation from an explanation of cause.
Make the blog and video complement one another
A blog article can explain a concept and the conditions for a decision, while a video demonstrates implementation. Rather than reproducing content word for word on both channels, consider which format works best for which information. Step-by-step installation may be more useful on video, for example, while a model comparison may work better in a table that can be updated.
Google’s SEO starter guide emphasises pages that are useful to readers and easy to navigate. [3] A practical task arising from that is to provide a meaningful explanation beside a video and a link to the necessary next step. Merely embedding a video without explaining the page’s subject makes it harder for readers to know whether they are in the right place.
What an agency report should contain
State the period and scope in the opening section. Then explain the most important content need, the observed change and the recommended work. Do not stop at “Impressions increased”. Identify the topic group in which they increased, how clicks changed and whether a connection to the business objective could be established.
Do not present a visibility score from a tool as a score awarded by Google. Google explains that third-party tools generate their own estimates and cannot guarantee ranking success. [4] Attribute Search Console data to Search Console, social-platform data to its own source and the agency’s interpretation to the agency as a recommendation.
A practical content experiment for the first month
Choose one customer question and first identify the formats already answering it. A demonstration video, a short explanation and a comparative blog article can serve different roles. Record each item’s publication date and expected reader behaviour. The purpose is to answer the question fully, rather than meet an equal post quota on every channel.
In the initial assessment, examine search impressions, clicks and whatever subsequent behaviour you can measure separately. If the result is low, do not immediately declare that the subject has no demand. Check alignment between title and content, image or audio quality, information freshness and whether the destination link works. If a longer measurement period is needed, set the next review date.
An illustrative example of distributing a support topic across channels
Suppose the same installation error is repeatedly raised for a product. The content team first uses support records to establish at which stage it occurs. A first-installation question from someone who has never used the product should not be combined with a problem arising after an update. Anonymise records and separate them by need; do not portray the number of support requests as the proportion of all users experiencing the problem.
A long video can demonstrate installation, a short video can explain the symptom that identifies the error, and a blog can maintain version conditions and a troubleshooting table. You do not have to repeat all the information on every channel. However, brevity offers no benefit if a format omits a critical safety or usage condition. Supply essential conditions in the description or through a clear link.
Queries from Google can show that these pieces are discovered for different needs. If the short video appears for compatibility queries, check whether it genuinely answers that question instead of changing its title to cover everything. If it does not, consider a new comparison or clearer direction to the existing blog. Receiving impressions for a query does not mean the existing content is the right answer.
After a month, assess both search discovery and feedback from the support team. If support requests have decreased, other influences such as product mix, seasonality or a software fix may also be involved. Check the scope of the data before concluding that content alone generated savings. This illustrative scenario distinguishes content roles; it makes no claim about results.
Keep the comparison file maintainable
Every row in your report should identify the content URL, platform, publication date, review period and topic group. If a post’s title changes later, continue tracking it through the same URL. Do not present deleted or reuploaded videos as an uninterrupted continuation of the same record. Where several versions exist, use a short note explaining which version answers which current question.
If you group queries manually, document the classification rules. A group one team member calls “installation” may differ from another’s “technical support” group. A glossary and examples keep comparisons consistent across periods. When introducing a new topic group, state whether older data have also been reclassified; otherwise an artificial increase may appear.
You need not present every row to the business manager. Explain the few findings requiring a decision and the proposed work in the executive report, and retain detailed records as supporting material. It should be possible to trace the query and content gap behind a recommendation such as “Let us produce a new short video for this subject”. The report then becomes more than a retrospective table of numbers.
Frequently asked questions
Does Search Console show all views within a platform
This guide concerns discovery through Google and the associated performance. To learn about all impressions in the TikTok or Instagram feed, consult the platforms’ own reports. Make the source explicit in every report table.
Can we add clicks from different channels together
You can calculate total clicks for the same period and reporting scope. Do not call the result unique users. Adding rates or calculating overall CTR from a simple average can also be misleading.
Should every item with more impressions be replicated
First assess the relevant audience’s need and the business objective. Content that has appeared widely but created the wrong expectation should be corrected before being expanded. Impressions are only one input to a content decision.
References
Sources accessed on 27 October 2026. Announcement dates, research data periods and illustrative calculations are identified separately in the text.
[1] Google Search Central Blog. See how content from social and video platforms performs on Google Search. 7 July 2026. Platform properties and setup process.
[2] Google Search Central Blog. Platform properties roll out globally plus a new social and video performance guide. 29 July 2026. Global rollout and analytical examples.
[3] Google Search Central. SEO Starter Guide. Page structure, reader benefit and navigation. Accessed 27 October 2026.
[4] Google Search Central. Guidance on third party SEO tools services and advice. Update of 5 June 2026. Assessing external tools and performance claims.


